Enter your account email and password
Not Registered?
By using Map Maker, you agree to the terms
Default
Silver
Night
Dark
Retro
Aubergine
Turn on or off the display of labels on the map.
This applies to the labels of countries, states, provinces, cities, roads, businesses, etc.
Turn on or off the display of raods on the map.
Turn on or off the display of landmarks on the map.
This applies to national parks, borders, geographic boundaries, the International Date Line (IDL), etc.
The language to use for text items on the map. This applies only to the map and not to the Map Maker User Interface.
Enabling this option will make the map change zoom and scaling so that it contains all visible locations and drawings on the map whenever changes are made.
Disable this option if you make frequent changes to the map and want to prevent the map from zooming away from the current area of focus.
Enabling this option will display crosshairs on the map that intersect at your mouse pointer.
Enabling this option will display lat/lng coordinates at your mouse pointer when hovering over the map.
Enabling this option will display details when hovering the mouse over objects on the map, e.g. hovering over a location marker shows the marker name and coordinates.
Disable if you do not want to see details when hovering over map objects.
Enabling this option will latitude and longitude graticule lines on the map.
Enabling this option will allow you to drag and drop items to new coordinates on the map.
Disabling this will help prevent accidental dragging and dropping.
Note: To drag a marker on the map, click on the marker once to acivate it, then click again to drag-and-drop the marker to its new location on the map.
Enabling this option will display your current GPS location on the map.
For this to work correctly your device will need to have GPS enabled and you will need to grant GPS access to MapMaker.
Not shared with any users

Loading Map Maker...

or, edit the layer's default icon
The main color and transparency of pins in this layer.
The color and transparency of the pin's outlining border and center dot.
The main color and transparency of plotted dots in this layer.
The color and transparency of the border around dots.

A custom name for this territory
The color and transparency of this territory on the map.
If you need help, please contact support.
By using this site you agree to the Terms of Service.
Upgrade Map Maker to access more features
Free 14-Day Trial
Need Help? Contact Us
Plan: $290 /year (2 free months) (change)


Subscription Payments are securely processed by Stripe. You will be charged today and at the beginning of each billing cycle until you cancel your subscription.
Cancel at any time in Account > Subscription > Billing Portal.
| Email: | [email protected] |
| Telephone: | +1 (561) 570-6277 (USA) |
| Mailing Address: |
My Maps Inc. 170 NE 2nd St. #404 Boca Raton, FL 33429 |
Use StreetTours™ to create a touring using "Street View" with pre-determined "stops".
Each stop along the tour can be customized so that it is "looking" in the desired direction, i.e. you can control the heading (360° rotation) and tilt (up or down).
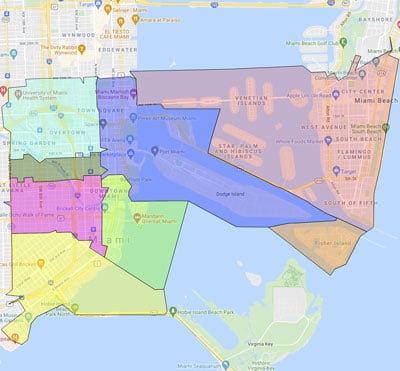
Click "Add To Map" to highlight a territory on the current map
Use the Territory Manager to create/edit custom territories.
You can then add your custom territories to maps by using the territory search feature.
No Custom Territories
Click to create a new territory.
Select or create a territory to edit

You can now start making and sharing maps!
We suggest reading the Documentation to help you get started.
If you need any help, please contact our support team.
Enter the decimal-format lat/lng.
(Some basic DMS to decimal conversion is attempted, but decimal works best)
Import by entering the locations below
Lat, Lng, Name, ColorOne location per line using the following comma-separated (,) fields:
latitude, longitude, name, color
e.g. 25.767368,-80.18930,Miami,#FF0000
Supported File Formats: csv (recommended), xlsx, xls, ods, tsv, txt & kml
Max File Size: 20MB for csv; 2MB for all others
Max Locations:
The new map will load after you create it.
All your maps are accessible from the "Maps" drop-down at the of the page.
Create custom maps styles using Google Maps JSON style code. Styles define the map's style settings. View the Style Classes Help Article or use the JSON style code generator.
You have not created any styles.
Click the icon to create a new style.
Select or create a style class to edit
Thank You! Your account has been upgraded.
If you still receive notifications to upgrade, please refresh the page to clear cache.
Contact us if you need any help using Map Maker.
You will not be charged again. Access to upgraded features will expire at the end of the current billing cycle.
If you need help with MAPS, please contact us anytime.
This is the location data in this layer.
Experimental Feature: Click on a value to edit and press enter/return to save changes to the server. At this time, you may still need to refresh the page before seeing changes locally. Please report bugs.
Up to 5MB in one of the following formats: JPG, GIF or PNG
Map Maker is an advanced Web-based system for creating, editing & sharing custom maps.
Map Maker is an advanced Web-based system for creating, editing & sharing custom interactive maps.
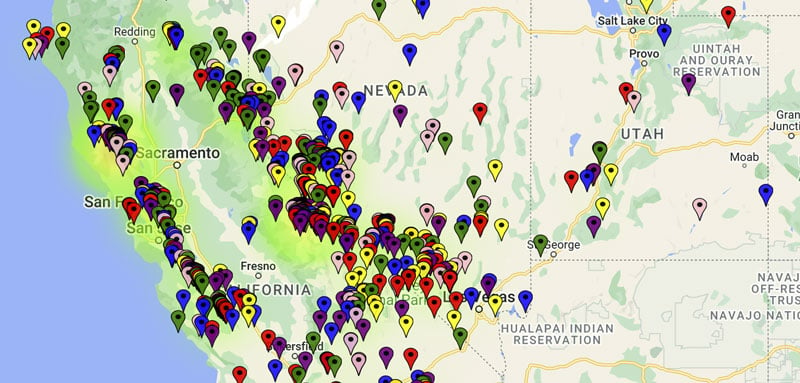
Plot location coordinates, add territories, draw shapes on the map, import data from files, upload custom icons, display heatmaps, calculate area/perimeter and more!
You can share maps privately or publicly, or embed maps on Websites.
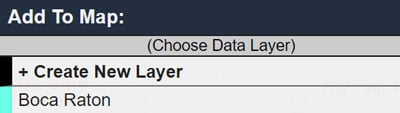
To add individual locations, the easiest way is to click the map where you want to add a marker and choose "New Layer" under the "Add To Map" option. You can also add locations to existing data layers to keep location data grouped together.
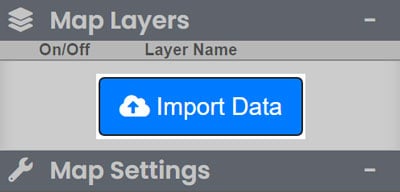
To batch import locations, click the "Import Data" button to launch the data importing wizard. You can upload a .csv spreadsheet with your locations, or you can copy/paste the locations. You can import data to a new or existing layer.
Map Maker allows you to extensively customize marker icon sizes, colors, opacity, etc.
You can customize icons for individual locations, or for a data layer so that all locations in the layer adopt the layer's default icon.
You can also upload a custom images to use as icons.
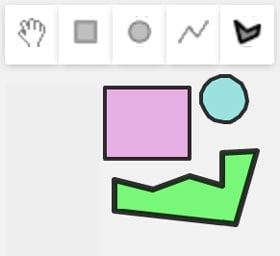
The Drawing Tools allow you to easily and quickly draw virtually any shape on the map. You can draw circles, rectangles, or use the polygon drawing tool for more complex shapes.
By default shapes are added to their own layer (under "Map Layers") so that they can be independently customized.
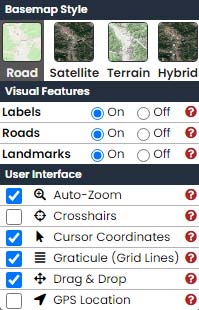
You can use the "Map Settings" to customize many aspects of the map's visual appearance.
Choose from a number of basemaps, e.g. road map or satellite view, and control things like labels for popular places, view or hide roads, display outlines for landmarks and borders / boundaries.
Advanced user interface settings are also available, e.g. crosshairs that follow your mouse, "drag & drop" to easily move markers with your mouse, and Auto-Zoom, which automatically zooms in and out to fit all map objects within view whenever items or added or removed.
These settings can be customzed for each map.
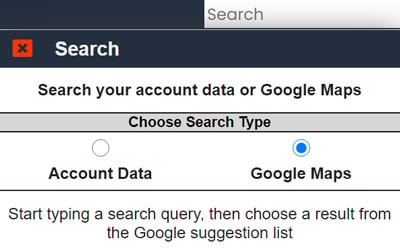
Using the Search Box (top right) makes it easy to find what you're looking for.
Search Google Maps to find locations, businesss, etc anywhere in the world.
Or, search your account to find layers, maps, etc. that you have already created and saved.
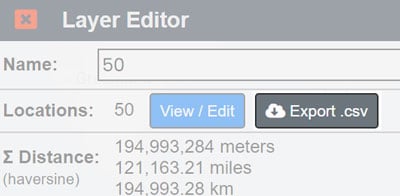
Once you've created layers with location data, click the Export .csv button in the Layer Editor to download a spreadsheet containing location data.
To continue using Map Maker, please buy a Map Maker subscription.
Need Help? Contact Us
To continue, please buy a Map Maker subscription...
Need Help? Contact Us
Map Maker Free includes a limited number of maps, layers, locations, geocodes, etc.
To access to more features, please upgrade Map Maker.
Plot data by entering comma-separated (,) location data (one location per line).
Field Ordering:For more flexible importing options, use the file import option instead.