Clustering
Similar to heatmaps, a clustering analysis helps to rapidly visualize the dispersion of plots on the map. In addition to providing a coloring schema, clustering quantifies the density of locations by displaying the number of location plots in the cluster.
Clusters are dynamically adjusted with zoom level, i.e. as you zoom in or out, clustering will be recalculated and redrawn to best visualize clustered data at the given zoom level.
Clustering is enabled on a per-layer basis. This offers the flexibility of applying cluster visualizations to only the desired datasets.
Example: Clustering Location Data
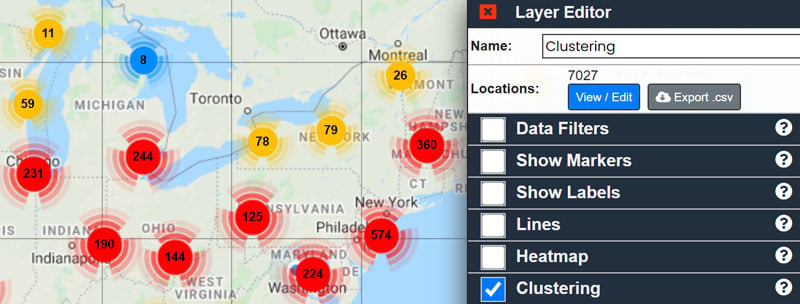
Step 1: In the Layer List — to the left — click on the layer for which you want to enable clustering.
The Layer Editor will open.
Step 2: Click the "Clustering" checkbox. This will enable data clustering for the layer:
NOTES:
- When clustering is enabled, individual markers may not be visible until fully zoomed in.
- To remove data clustering, uncheck the "Clustering" option in the Layer Editor.
- To improve performance, clustering is automatically enabled for layers with over 10,000 location plots.