Heatmaps
For datasets containing a large number of locations plot, a heatmap can help visualize the density / dispersion of plots on the map.
With Map Maker, heatmaps are enabled on a per-layer basis. This offers the flexibility of applying heatmap visualizations to only the desired datasets.
Example: Displaying Heatmaps
Step 1: In the Layer List — to the left — click on the layer for which you want to enable a heatmap.
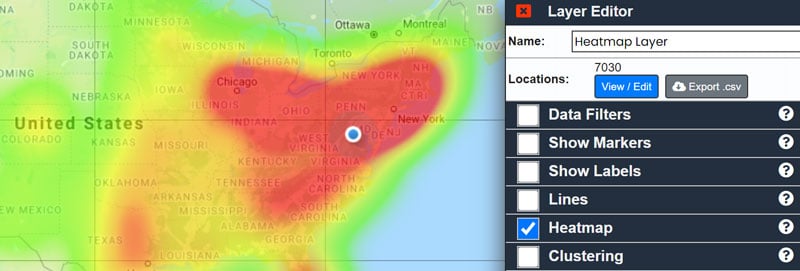
The Layer Editor will open.
Step 2: Click the "Heatmap" checkbox.
NOTES:
- Heatmaps may be displayed independently of other options, e.g. markers can be turned on or off and the heatmap option will still work. In the example above, markers are disabled to better display the heatmap.
- To remove a heatmap, uncheck the "Heatmap" option in the Layer Editor.