Plotting Points (Lat/Long Coordinates) on the Map
Plotting latitude and longitude coordinates (points) is an easy task with the Map Maker.
If you have multiple geographic coordinates to plot, we recommend creating a spreadsheet with your plots and then importing the spreadsheet to Map Maker. Using a structured format, such as a spreadsheet, makes it easy to manage and process the data.
Creating a Spreadsheet with Coordinates
First, open a new blank sheet in Microsoft Excel or a similar spreadsheet editing application.
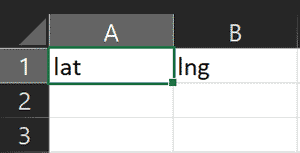
In the very first row (the “header row”), enter “lat” in the first column, then enter “lng” in the second column. Identifying columns in the header row is required and allows Map Maker to parse the information. Your spreadsheet should now look like this:
You can now add the locations you want to plot to your spreadsheet by entering the latitude/longitude coordinates-pair for each location that you want to plot. You can either enter them manually or copy/paste them from elsewhere.
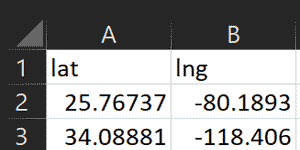
In the example below, we’ve added the lat,lng for 2 locations (Miami and Los Angeles):
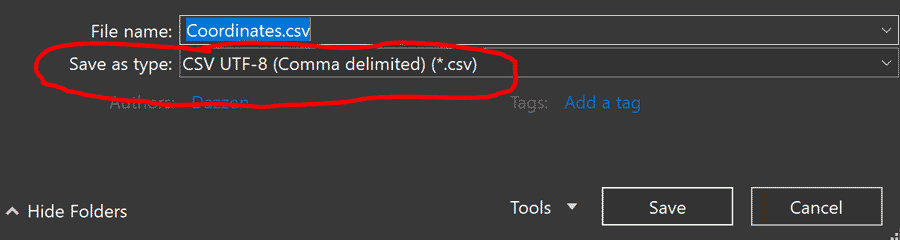
Once you’ve added all of your locations into the file, save the spreadsheet as a CSV (Comma-Separated Values) file somewhere on your computer.
Tip: To save as a CSV in Microsoft Word, click File > Save As, then choose where to save the file. When prompted with the “Save As” file dialog, make such to select “CSV UTF-8 (Comma Delimited) (*.csv)”. Your option may differ slightly, but make sure it’s the *.csv option, which means it will use the .csv filename extension:
You are now ready to plot the coordinates by importing the location data to Map Maker.
Note: In this example we have limited the data to coordinates only, however Map Maker also supports additional columns, e.g., “name”, “color” and “note”. You can also import custom data fields. For more details, see the importing csv files page.
Plotting Coordinates:
Also See: importing coordinates via CSV (with screenshots).
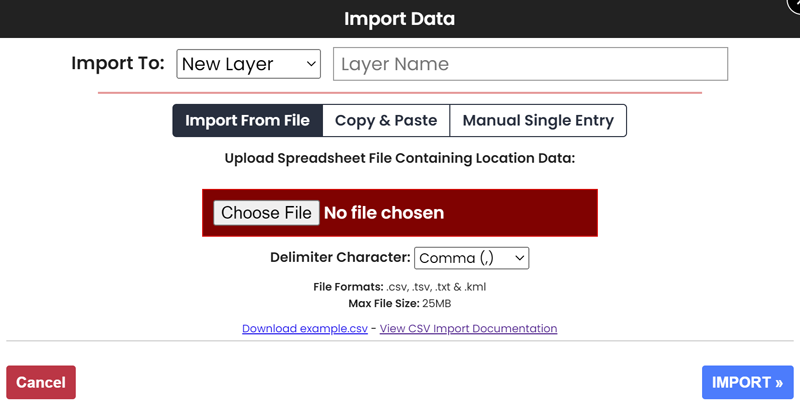
On the Map Maker, click the large “Import Data” button on the left side of the application. This will launch a modal window where you can upload the spreadsheet file containing the locations you want to plot.
By default, the “Import From File” option should be selected. If this option is not selected, select it by clicking “Import From File”:
First, you will need to give a name to your data import (a name for the “layer” that will be created with your plots). At the top of the modal window, enter a name in the “Layer Name” field. Note that you can also import data to existing layers that you have previously created.
Now, click “Choose File” button. This will launch a file-browser window that you can use to navigate to the spreadsheet file you saved on your computer. Once you have selected the file, click the confirmation dialog in the file-browser window. The file is now loaded and ready to be uploaded.
Click the “Import” button in the modal window. This will initiate the upload of the location-data spreadsheet. Importing the file should take only a couple of seconds (depending on the size of your file and Internet speed).
Once the spreadsheet is imported you will receive a confirmation dialog saying how many locations were imported, and a new layer with your plotted locations will load on the map.
Now you can start customizing the plotted locations, e.g., choosing location marker colors / images, drawing lines between the locations to create a path, enabling heatmaps, etc.