How to Make a Map & Plot Locations
Making a map is a creative process and there is no one specific method or process to make a map. It is common for cartographers (professional map makers) to develop their own strategies and processes over time, tailoring their workflow to what feels most natural to them and the maps that they want to create.
Our online Map Maker provides all of the tools necessary to make custom geographic maps.
The tutorial below provides a basic outline for how to make your first map. As you gain familiarity with the different map customization options in the Map Maker, you too can adapt your workflow to what feels and works best for you.
Overview:
Basic Steps:
Advanced Steps:
- Draw on the Map
- Customize Map Styles
- Geocoding Addresses to Coordinates
- Perform Geospatial / Data Analysis
- Sharing & Publishing the Map
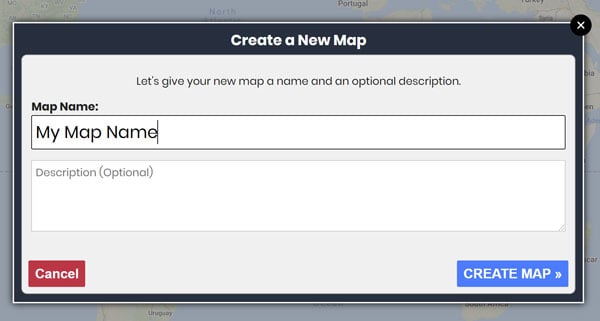
Creating a Blank Map
The first time you visit the Map Maker, a new blank map will be automatically loaded. If you have already edited this map and don’t want to make changes, you can always make a new blank map. We also recommend keeping a test map for experimental purposes, as this will allow you to experiment with features and settings before using them on your real live maps.
Plot Map with Locations / Geo Coordinates
For most users, the important step in making a map is importing location data (plotted locations). The best way to import data is by uploading a spreadsheet in .csv format (Comma-Separated Values).
You can also click on the map to add locations manually by clicking on the map and choosing an option in the “Add To Map” section.
When adding locations, you must create at least one “layer”, which serves as a container for the location data. After creating a layer, you can add additional locations into that same layer, or you can create new layers to segment data.
Layers allow you to group locations/plots together so that they can be edited in batches, rather than having to edit each location manually. For example, if you update the layer’s color settings for location marker pins, then marker pins for all locations in the same layer will be automatically updated to reflect the new color settings. If locations were contained in separate layers, updating the settings for one layer would not affect locations in other layers.
By default, locations adopt their containing layer’s settings, however, you may also customize settings for individual locations, which will override the layer’s settings. For example, you can change the marker icon, color or size for an individual location so that it appears differently from other locations in the same layer. To do so, simply click on the location and change the settings in the “Location Editor”.
Draw on the Map
Map Maker allows you to draw shapes and lines on the map. This means you can manually draw things like polygon shapes, circles illustrating a radius, poly-lines, call-outs, etc.
To draw a shape, select one of the Drawing Tools. When a tool is selected, it becomes highlighted to indicate that it currently active and ready to draw. Then, click the map to start drawing the shape.
![]()
Once a drawing is created, a new layer representing the layer will be created and added to the map. This drawing layer can be used to edit the drawing settings or to add the drawing to other maps.
Customize Map Styles
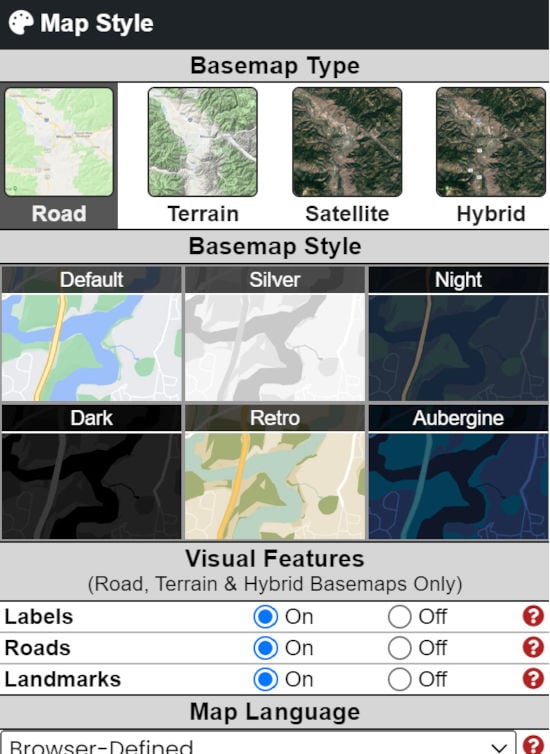
The Map Maker’s default map style may not be ideal for your needs. For this reason, you can customize many aspects of the map settings, e.g., colors and map features.
Map style setting options include:
- Basemap color scheme (land, text, roads, etc.)
- Toggling of Visual details (roads, landmarks, labels, etc.)
- Enabling/Disabling the “info box” when hovering the mouse
- And more
Several pre-defined basemap styles are available, including some dark themes, e.g. “Dark”, “Night” and “Aubergine”. One aspect to keep in mind when selecting a basemap style is the color scheme of the elements that will appear on the map, and how they will contrast with the background colors. Of course, any location markers and drawing objects created by Map Maker can be customized, so it is possible to select colors that contrast well with any basemap.
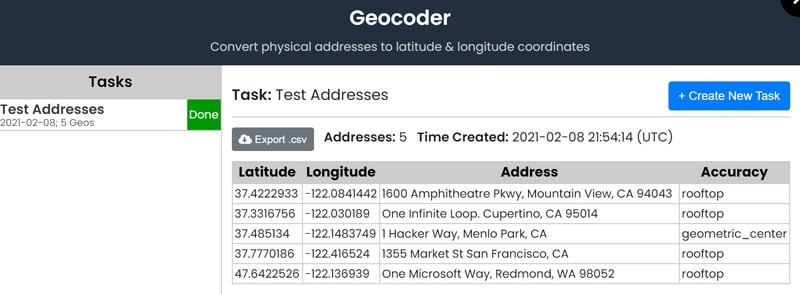
Geocoding Addresses to Coordinates
If you have human-readable addresses that you want to plot on the map, these must first be converted to geographic coordinates – latitude/longitude pairs – so that they can be plotted.
This process is known as “forward geocoding”. It’s also worth noting that going in the other direction, i.e., converting geographic coordinates to street addresses, is known as “reverse geocoding”.
Our Map Maker software includes a geocoder function that can convert batches of addresses to latitude/longitude coordinate pairs.
To learn more about geocoding, please see: Geocoding Address to Coordinates.
Perform Geospatial / Data Analysis
Once you have imported your location plots, the Map Maker has the data needed to perform geospatial analysis on the locations. Map Maker performs geospatial analysis at the Layer level and not at the Map level. This means that you can apply different analysis settings on layers independently, which gives you more control over the maps you can make.
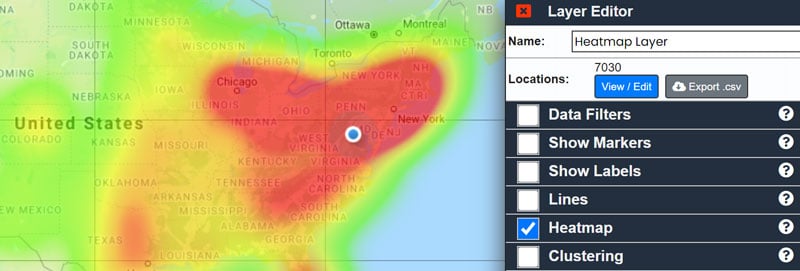
To access the geospatial metrics and analysis settings, click on a data layer in the list of layers to launch the “Layer Editor”.
By default, Map Maker automatically calculates certain metrics for each layer, e.g., the “Sigma Distance”, which is the sum of the direct-line distances between the plotted coordinates in the layer (using the Haversine / Great Circle method).
Several advanced analysis features are available, including Heatmaps to visualize density/intensity, and Data Clustering so that you can see the sizes of clustered location plots.
Sharing & Publishing the Map
Once you have created a map, you can then publish a read-only version of the map publicly or share the map privately with others so that they can view or edit the map.
To share a map publicly, click on “Publishing” and check the “Publish Map” option. When this option is checked, you will be able to see the map’s “permalink” URL address. You can share this URL with others and they will be able to view the map, however they will not be able to edit the map. To make the map private again, uncheck the “Publish Map” option and the map will no longer be accessible via the URL.
To share the map privately with others, please see the “Adding Map Users” setting, which allows you to add people by using their email address. When you add users, you can choose whether they have permission to edit the map or only to view the map.
Users are added on a per-map basis and not at the account level; if you create a new blank map, you will have to manually add users to that map even if you have added them to other maps in your account.